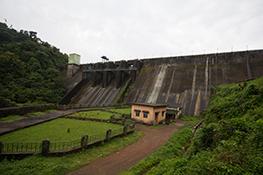
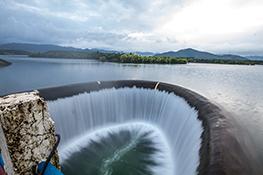
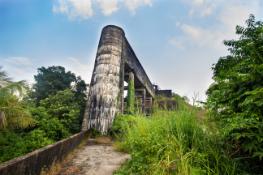
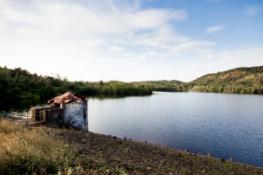
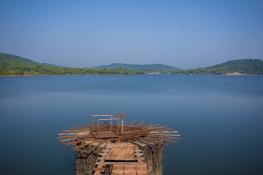
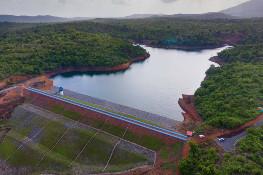
Dam Level Monitoring
% of dam filled
Line graph of water levels in the reservoir
Cumulative Rainfall for the last 7 days
Line graph of water levels in the reservoir
Cumulative Rainfall for the last 7 days
% of dam full
Line graph of water levels in the reservoir
Cumulative Rainfall for the last 7 days
% of dam filled
Line graph of water levels in the reservoir
Cumulative Rainfall for the last 7 days
% of dam filled
Line graph of water levels in the reservoir
Current discharge of water on a daily basis
% of dam filled
Line graph of water levels in the reservoir
Current discharge of water on a daily basis
Line graph of water levels in the reservoir
Current discharge of water on a daily basis
Raw Data
| Date | Dead level (m) | Full level (m) | Max storage (Ha.m.) | Current Level (m) | Current Storage (Ha.m.) | Discharge (cumecs) | |
|---|---|---|---|---|---|---|---|
| tillari | 3 hours 37 min ago | 64.00 | 113.20 | 46217.00 | 94.18 | 20496.60 | 0.00 |
| selaulim | 3 hours 37 min ago | 20.42 | 41.15 | 23436.00 | 33.57 | 10035.00 | 10.50 |
| anjunem | 3 hours 37 min ago | 61.50 | 93.20 | 4483.00 | 78.52 | 1383.20 | 2.45 |
| chapoli | 3 hours 37 min ago | 22.00 | 38.75 | 1122.00 | 32.93 | 606.25 | 0.00 |
| amthane | 3 hours 37 min ago | 29.00 | 50.03 | 585.00 | 43.86 | 199.00 | 0.00 |
| panchawadi | 3 hours 37 min ago | 14.70 | 26.00 | 436.80 | 20.50 | 140.62 | 0.00 |
| gaunem | 3 hours 37 min ago | 46.00 | 63.50 | 177.00 | 58.19 | 93.65 | 0.00 |
गोवा जलसंपदा विभागात आपले स्वागत आहे
About Us
Acts & Rules
Citizens Corner
Online Services
Schemes & Policies
आमचे प्रकल्प
महत्वपूर्ण दुवे
India Portal
Official Portal of the Republic of India
Goa Govt
Official Portal of the State of Goa
Central Water Commission
Official Portal of Central Water Commission
Department of Water Resources, River Development & Ganga Rejuvenation
Official Portal of the Department of Water Resources
Digital India
Digital India Program
Digital Locker
National Cloud based Platform for Document Storage
Material featured on this site may be reproduced free of charge in any format or media without requiring specific permission. This is subject to the material being reproduced accurately and not being used in a derogatory manner or in a misleading context. Where the material is being published or issued to others, the source must be prominently acknowledged. However, the permission to reproduce this material does not extend to any material on this site, which is explicitly identified as being the copyright of a third party. Authorisation to reproduce such material must be obtained from the copyright holders concerned.
Last Reviewed & Updated on 21 Mar, 2024

